I wondered, given the well-covered distance between the proportion of votes and proportion of seats last night, whether there was anyone doing a breakdown of the election under the lens of a Proportional Representation (“PR”) system. I couldn’t find one, so I made one. And then I wondered how things would be different if we used more realistic implementations of PR. The results are interesting.

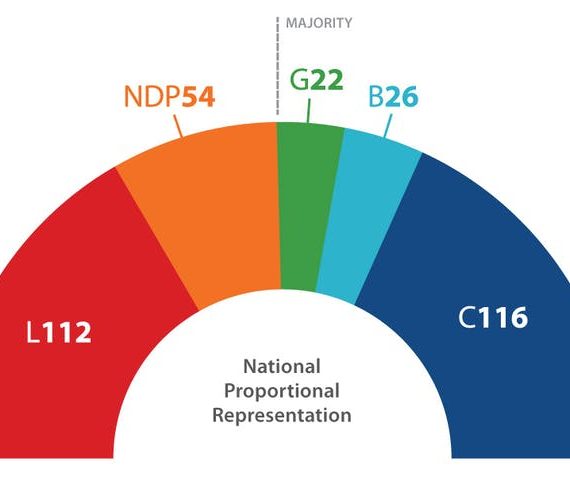
We have 338 seats in the House of Commons, but when one is figuring the results of a List PR system, there are inevitably rounding errors, and you end up with slightly less than 338 seats allocated. Here the seats are perfectly aligned with popular vote. But.
The Committee on Electoral Reform didn’t even analyze a purely National List PR system, because it takes away any sense of local representation. In a country with as many sparse, rural ridings as Canada, that’s a huge drawback.
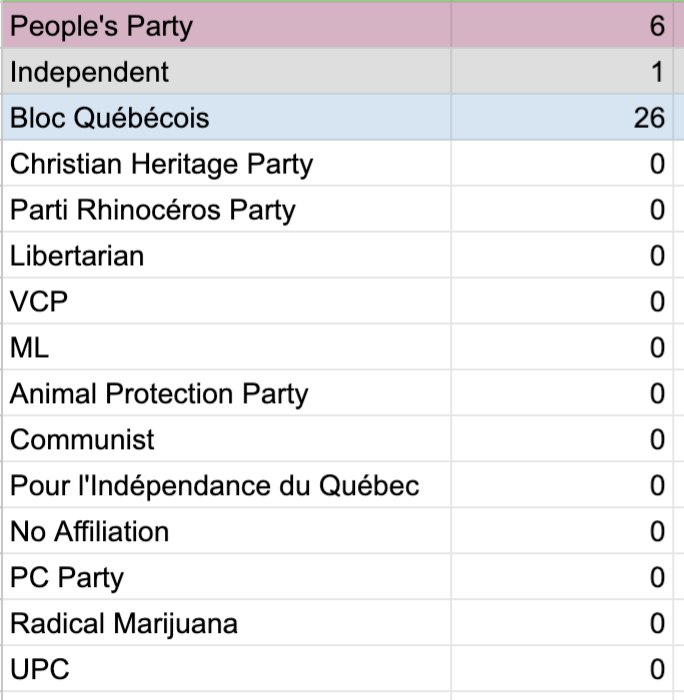
But there are other options! The simplest of these, and as far as I’m aware, not one on anyone’s radar, is Provincial List PR. In this (purely theoretical) system, we would treat each province as a single multi-member riding that elects the same number of members that it elects today.

Note that the overall result does not change much from the National List option, but we can already see proportionality at the local level. Newfoundland, for example, which has 6(!) Liberal members right now, has just 3 under this option, and 2 Conservatives.
This is a very useful reference point, but as I said, nobody is really considering a system like this. What is being looked at, however, is multiple-member ridings. There are a lot of systems that include this mechanism, not all of which can be simulated with the data on hand, but we can do a very rough characterization by simply combining districts in the numerical order of their electoral riding designation.
(See the full spreadsheet’s 5-member tab for the complete dataset)

Note how steeply the Greens and PPC drop off here. That was a surprise to me!
I did similar exercises for 4- and 3-member ridings, and while the overall distribution changes a little, they are similar enough that I feel we get a sense of how these systems would work for us should we choose something similar for the next federal election.


So that’s it, for me. I’m assuming someone out there has the equivalent for MMP, which is basically half National List PR, half 2-member ridings. Feel free to take a copy of my sheet and build that view for yourself.
My data is in the Raw Data tab, and was taken from the Elections Canada Election Night Results website. As I understand it that data may not be complete just yet, but again, the point isn’t perfect accuracy – I’m just trying to show how things could have played out, and how PR results vary as we tweak the parameters.